Skip to content
When formulating social media strategies, even the best minds are hit with a “Will it work?” brick wall. While no one knows the right answer, knowing that you have pulled all your stops is necessary.
Figuring out how much you’re getting back from your social media efforts can be tricky. Unlike traditional measures like leads or sales, social media’s return on investment (ROI) isn’t always clear.
Fear not; some important numbers act like guiding lights in this social media maze.
These key social media metrics help you predict how well your content will do on different platforms, with different groups of people, or at different times of the year. It’s like having a sneak peek into the future, giving you an idea of how your brand story will connect with specific audiences.
For marketing folks, understanding these metrics is like having a superpower. It lets you make smart decisions that fit the ever-changing world of social media.
This blog will break down these essential metrics, showing how they help you understand and improve the performance of your digital marketing efforts. So, let’s dive into the basics and make sense of social media metrics for strategic minds in the marketing world.
What Should Your Social Media Metrics Report Include? (Top Metrics to Track)
1. Post Engagement
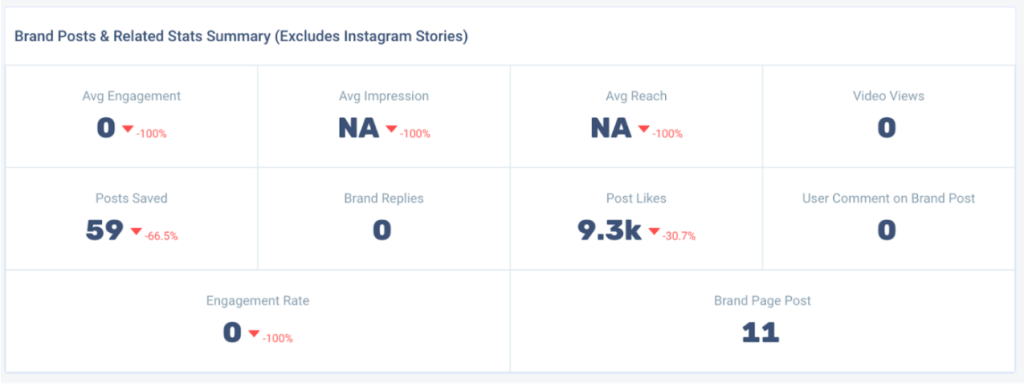
Overall post engagement includes:
- Average Engagement Rate: This metric represents the percentage of your followers actively engaging with a specific post. For instance, if you have 10,000 Instagram followers and a post receives a total of 1,000 likes, 50 comments, and 20 shares, the average engagement rate would be
([1,070 / 10,000] * 100). = 10.7%
It helps gauge how effectively your content resonates with your audience.
- Average Impression: The total number of times your content is displayed across users’ feeds. If your Facebook post has 5,000 impressions, it means it appeared 5,000 times, irrespective of clicks. This metric provides insights into the potential visibility of your content.
- Average Reach: This metric measures the number of unique users who saw your content. This is the first step to reaching a relevant audience who can be your loyal customer. If, of those 5,000 impressions, 3,000 are unique users, your average reach is 3,000. It gives a clearer picture of your content’s impact on your audience and what you can do to increase your reach.
- Video Views: The count of times your video content has been viewed. If your YouTube video gets 10,000 views, it implies that 10,000 people watched at least part of your video. You can dive deeper, know where your viewers are dropping off, and make relevant improvements to keep their attention.
- Posts Saved (in the case of Instagram): The number of users who saved your Instagram post says a lot about the equation between your followers and your content. If 100 users saved your post, it indicates that these users found your content valuable or interesting enough to revisit later.
Saves and shares go above comments and reactions for me. These metrics show that someone is truly interested in what you’re offering and think their community will be as well. Plus, when people are recommended something by a friend (even as simply as in a share), they’re much more likely to consider it. So, this is a big one for me! |
- Replies: The number of replies (both positive and negative) portrays that your social media efforts have a pulse. While having a consistent flow of positive responses is great, negative replies also allow your brand to fine-tune certain services to suit your customers’ expectations. These are the number of direct responses to your posts, often building an overall brand perception. For example, if your Twitter post asking a question receives 20 direct replies, it showcases engagement and interaction with your audience who are using your services or are interested.
- User Comment on Brand Posts: This is the count of comments on your posts and is every social media manager’s beautiful dream or worst nightmare. Like replies, both positive and negative comments on brand posts is crucial to help you build your buzz in the marketplace, If your Facebook post receives 50 comments, these interactions can include customer feedback, questions, or general engagement, reflecting the health of your online community.
2. Followers and Reach
Followers and reach set the benchmark of the social media success of a brand. They set the foundation for how well a brand will perform, based on which metrics like conversion rate stand a chance to gain amplification.
Followers: It is the total number of people subscribed to your social media account. If your Instagram gains 500 new followers in a month, it indicates growth in your audience. Losing followers might prompt a reassessment of your content strategy. While consistently growing your followers is great, conduct a quarterly audit to understand the percentage of relevant members in your list. The greater the percentage, the greater the chance of creating a purchase-friendly clientele.
Reach: This is the number of unique users who saw your content. If your Twitter post reaches 10,000, your message has reached 10,000 unique users. Reach provides insights into the potential impact and visibility of your content. However, be careful of bots engaging with your posts because
3. Redirect to the Shop Link
This is where the money lies! As the name suggests, this link is crucial for ecommerce brands looking to build the conduit between their social media handle and their seller page.
As a brand owner managing a social media handle, one common challenge you might face is having a substantial number of followers on Instagram but experiencing low click-through rates on your shop link.
This can be addressed by strategically engaging your audience and creating a more enticing online shopping experience. Here are some effective tips that encourage your followers to click on the shop link, boost your conversion rates and drive sales.
Compelling Product Descriptions: Ensure your product descriptions are clear, concise, and compelling. Highlight key features, benefits, and any unique selling points. Make followers feel that they can’t miss out on your products.
High-Quality Visuals: Post high-quality and visually appealing images of your products. Instagram is a visual platform, and captivating visuals can grab attention and spark interest in your offerings.
Create a Consistent Aesthetic: Maintain a consistent aesthetic across your Instagram feed. A visually cohesive profile is more likely to attract and retain followers. Consistency builds trust and makes your brand more recognizable.
Run Targeted Instagram Ads: Invest in Instagram advertising to reach a broader audience. Instagram ads can target specific demographics, interests, and behaviours, increasing the likelihood of attracting potential customers to your shop link.
Optimise Your Instagram Bio: Ensure your Instagram bio is informative and includes a concise and enticing description of what followers can find in your shop. Use emojis to add personality and make it visually appealing.
Include Calls-to-Action (CTAs): Use clear and compelling calls to action in captions, stories, and bio. Encourage followers to click the shop link for more details, exclusive deals, or new arrivals.
Monitor Analytics and Adjust Strategy: Regularly review Instagram Insights to understand what content resonates most with your audience. Adjust your strategy based on insights, focusing on content that drives engagement and click-throughs.
Limited-Time Offers and Promotions: Introduce limited-time offers or exclusive promotions accessible only through the shop link. Create a sense of urgency to drive followers to click and purchase.
4. Analyse User Sentiment
User sentiment is a metric that gauges users’ overall emotional tone and attitude toward your brand on social media platforms like Instagram and Facebook. An important social media metric involves analysing comments, mentions, and direct messages to determine whether the sentiment is positive, negative, or neutral.
So why should you consider user sentiment as a social media metric?
Understanding user sentiment is crucial for assessing brand perception, identifying customer satisfaction levels, managing crises effectively, and obtaining valuable product feedback. It also aids in optimising content strategies, evaluating marketing effectiveness, and fostering strong customer relationships.
By regularly monitoring user sentiment, owners can stay attuned to the conversations surrounding their brand, address concerns promptly, and make informed decisions to enhance their overall social media presence.
How can you assess user sentiments?
User sentiment is often assessed using natural language processing (NLP) techniques, sentiment analysis tools, and machine learning algorithms. These methods analyse text data, such as comments, reviews, and social media posts, to determine the sentiment expressed.
However, there isn’t a specific equation that universally applies to all situations. Sentiment analysis typically involves more complex processes. Here’s a simplified explanation of the steps involved:
- Text Preprocessing: Clean the text data by removing irrelevant information, special characters, and punctuation.
- Tokenisation: Break down the text into individual words or tokens to track where and how often it has been used in user conversations.
- Sentiment Scoring: Assign sentiment scores to each token or sentence. Sentiments are categorised as positive, negative, or neutral, indicating the most common sentiment.
- Aggregation: Aggregate the scores to obtain an overall sentiment for the entire text. Different methods, such as averaging or weighted scoring, may be used to gather the overall brand perception online.
- Machine Learning (Optional): In more advanced cases, machine learning models are trained on labelled datasets to classify sentiment automatically. These models learn patterns from historical data to predict sentiment in new text.
Make user sentiment analysis easy for you with Locobuzz. Check out how you can integrate it with your social media management efforts! |
5. Profile Visits
Profile visits are a social media metric measuring how often users visit your profile on platforms like Instagram and Facebook. This metric is crucial because it reflects audience engagement beyond individual posts, indicating user curiosity about your brand or content. An increase in profile visits suggests effective content strategies, potential brand discovery, and exploration of products or services.
It also provides insights into user intent, helps assess the impact of promotional campaigns, and guides strategies for follower growth. Businesses can refine their social media strategies by analysing profile visits, optimising content, and staying competitive.
6. Share of Voice
Share of Voice is a metric that measures the presence and visibility of a brand or product within a specific industry or market compared to its competitors.
It quantifies the percentage of the overall online conversation or mentions a brand receives relative to the total volume of conversations within that industry.
It is often calculated by dividing the number of mentions of a brand by the total number of mentions in the industry and multiplying by 100 to get a percentage.
So, why is Share of Voice Important?
Competitive Benchmarking: Share of Voice provides a benchmark for evaluating a brand’s performance against its competitors. A higher share of voice typically indicates a stronger brand presence and influence in the market.
Brand Health Monitoring: By tracking the share of voice over time, brands can assess their market position and monitor changes in their industry influence. A declining share of voice might signal a need for strategy adjustments.
Campaign Effectiveness: Share of Voice is a useful metric to evaluate the effectiveness of marketing campaigns. If a brand launches a new product or promotional campaign, an increase in the share of voice can indicate heightened brand visibility.
Identifying Trends: Changes in the share of voice can help identify emerging trends within an industry. Increasing mentions for certain topics or keywords may signal shifts in consumer preferences or interests.
Informed Decision-Making: Brands can use share-of-voice insights to make informed decisions about marketing budgets, strategies, and resource allocations. It helps allocate resources where they are most needed for optimal impact.
For example, let’s consider a real-time example in the tech industry:
Suppose three leading smartphone brands—Brand X, Brand Y, and Brand Z—compete for market share. A social media analytics tool tracks online mentions related to these brands over a month. The results reveal the following: Brand X: 2,000 mentions Brand Y: 1,500 mentions Brand Z: 1,000 mentions The total number of mentions in the industry during this period is 5,000. The calculation for a share of voice is as follows: Brand X SOV: (2,000 / 5,000) * 100 = 40% Brand Y SOV: (1,500 / 5,000) * 100 = 30% Brand Z SOV: (1,000 / 5,000) * 100 = 20% In this scenario, Brand X has the highest share of voice at 40%, indicating that it dominates the industry’s online conversation. Brands Y and Z have lower shares but can use this information to adjust their strategies and increase their presence. |
Impact of Data Analysis on Your Social Media Metrics
1. Engagement Metrics and Data
Correlation: Data analysis helps interpret engagement metrics (likes, comments, shares) by providing context. For example, analysing which types of content receive the most engagement and when users are most active allows you to tailor your content strategy.
Example: Data analysis reveals that Instagram posts with carousel images receive more likes and comments. With this information, you can prioritise creating more carousel content to boost engagement.
2. Follower Growth and Data
Correlation: Tracking follower growth involves analysing data over time to identify patterns and trends. Understanding what factors contribute to follower acquisition helps refine your content and outreach strategies.
Example: Data analysis shows that collaborations with influencers consistently result in follower spikes. This insight encourages you to continue leveraging influencer partnerships for audience expansion.
3. Conversion Metrics and Data
Correlation: Conversion metrics (click-through rates, conversions, purchases) are closely tied to data analysis. By analysing user behaviour, you can identify the steps leading to conversions, optimise conversion paths, and measure the effectiveness of your calls-to-action.
Example: Data analysis of an e-commerce website’s social media traffic reveals that users who land on the site through Instagram have a higher conversion rate. This information directs you to prioritise Instagram as a conversion-driving channel.
4. User Sentiment and Data
Correlation: Sentiment analysis relies on data from user comments, reviews, and mentions. Data analysis tools help categorise sentiments (positive, negative, neutral) and track changes over time, providing insights into brand perception.
Example: Data analysis shows that the sentiment around a recent product launch on Twitter is predominantly positive. This positive sentiment can be leveraged for further promotional efforts and brand advocacy.
5. Share of Voice and Data
Correlation: Calculating the share of voice involves analysing the volume of brand mentions compared to competitors. Data analysis tools help quantify these mentions, providing a numerical representation of a brand’s presence in the industry conversation.
Example: Data analysis reveals that your brand has a 25% share of voice in the beauty industry. This benchmark lets you assess your industry standing and strategies for increased visibility.
6. Profile Visits and Data
Correlation: Profile visits are a quantitative metric, and data analysis helps contextualise these visits. Understanding which posts or stories prompt profile exploration and the characteristics of visitors enhances your overall social media strategy.
Example: Data analysis shows that profile visits peak after the release of new product announcements. This information prompts you to schedule regular product launches to maintain user engagement and profile visits.
Know Your Social Media Metrics to Ace Your Branding Game
Tracking your social media metrics is key to knowing how well (or not) your brand is performing on different platforms. While not all social media metrics are meant for every brand, the aforementioned elements are more likely to give you a detailed picture of how well you manage your social game.
With Locobuzz, you can view these metrics (and more) together on a unified platform and get key insights and on-demand reports that enable you to stay on top of your brand performance.
Want a little more than just a peek?
Get in touch with us!
Your Social Media Metrics Make or Break Your Brand