Social media platforms generate a large volume of data every minute. To put it into context Facebook alone generates 4 million posts per minute which adds up to 250 million per hour, while Twitter generates half a million tweets every minute. Awesome, isn’t it? The data generated is what we consider raw and can’t really be used to derive any solid insights.
As a CX tools platform, Locobuzz supports multiple social media platforms, more platforms mean more data – and more data requires a sophisticated system in place to handle the volume. Locobuzz has its own tool for customer experience like social listening, brand monitoring, omnichannel customer engagement, etc for data segregation and handling such a huge volume of data.
In this blog, let me walk you through the journey of raw data from social media to our Locobuzz dashboards, until a point where it delivers insights. Along the way, I’ll take you through some of the technologies that facilitate the process.
Phases
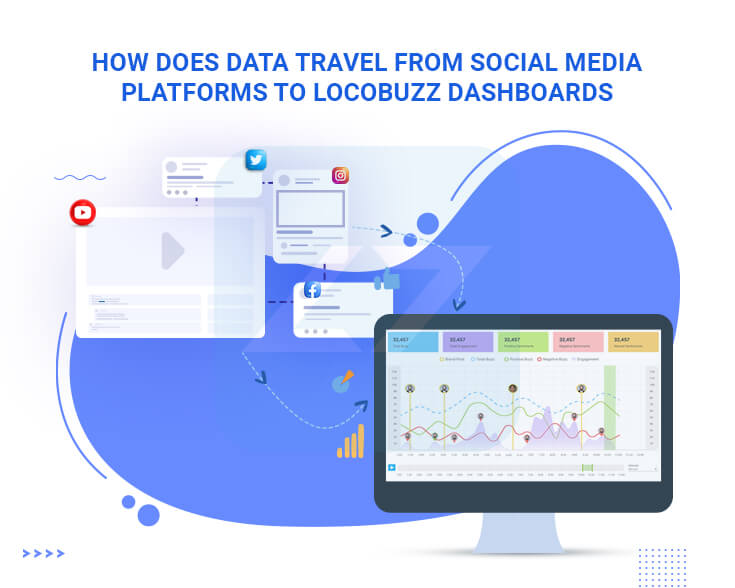
The data journey can be broken down into 4 phases:
- Get data from social media into locobuzz systems
- Enrich data and homogenize its structure
- Store cleaned data in database
- Dashboards query database and visualize the information
This process is analogous to preparing a meal:
- Gather all ingredients, spices, vegetables
- Chop/clean veggies
- Start cooking
- Present in a dish
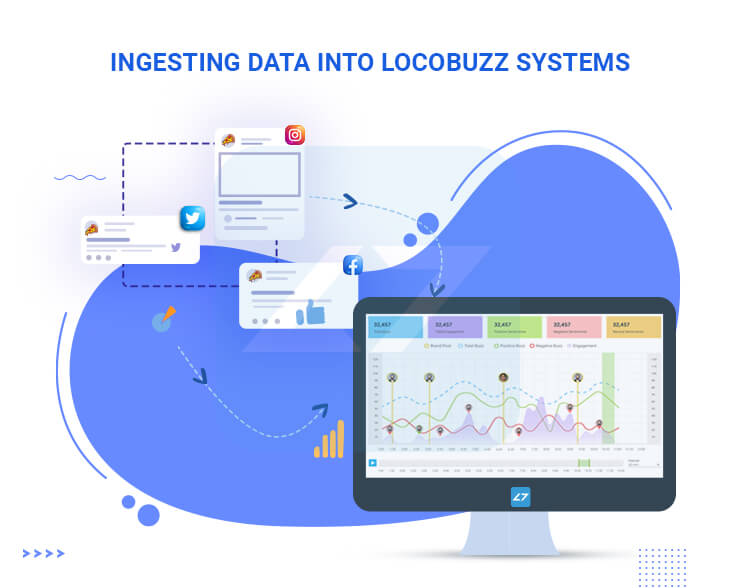
Data ingestion requires moving of data from social media onto Locobuzz, this is the first step into our data journey. There are various mechanisms used for data transfer, such as pull, streaming and polling mechanisms. What this means is –
- Pull/Webhooks inform the client services when new data is available, the service then pulls new data
- Realtime data is transferred in case of streaming, there is minimal delay between data generation and transmission
- In a polling mechanism, client services ask social media for new data periodically.
The mechanisms of data transmission differs based on platform, following is a grid of social platforms and the mechanism they use to deliver data to their clients. Like –
- Facebook/Instagram use webhooks
- Twitter use Streaming
- Linkedin/GMB/YT use API polling
Given the amount of data generated, Locobuzz’s ingestion capabilities scale according to demands, by scaling up on high data traffic and scale down when demand is less. These services follow a microservice architecture which ensures better scalability, deployment and fault isolation.
In our kitchen analogy, this is the stage where we get done with collecting the ingredients for our recipe. All spices/vegetables/meat has been bought from different shops into your kitchen table. The next step is to start cleaning and organizing them so you are ready to cook.
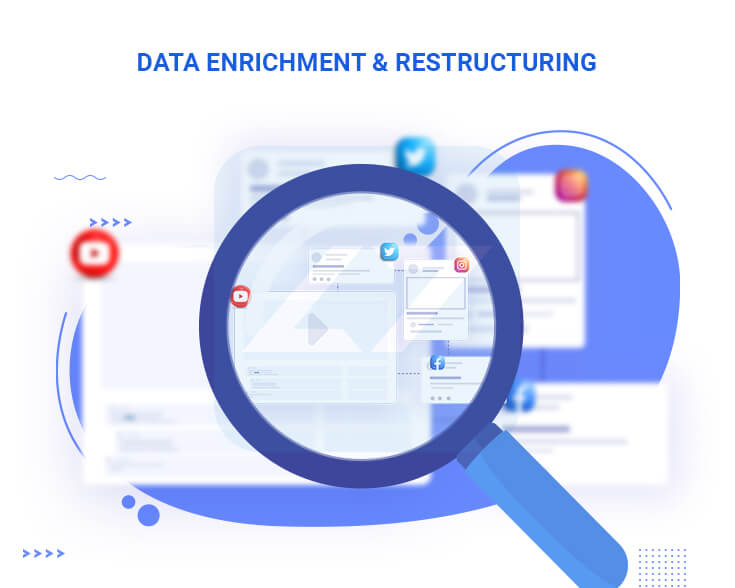
After receiving the data, the next step is to add more value to the data. This process is called Data Enrichment. Leveraging Artificial Intelligence and Statistics, new attributes are added such as:
- Sentiment
- Emotion detection
- Reach prediction
- Toxicity detection
- Category tagging
- Keyword and Hashtag tagging
The deep learning models which provide data for these attributes are deployed as APIs (Application Programming Interface), to adjust according to demand a load balancer is set up in front of the API to distribute load according to a server’s capacity.
Every social media has its own way of structuring data and this introduces lots of complexity when it comes to creation of analytical insights. The information available after the data ingestion step is still in its raw format. The solution is to homogenize the data structure across media streams, this makes it easier for the downstream applications to query data without having to worry about data structure.
With this, we have completed the second step aka ‘Mise en place’ of our analogy, ingredients are now chopped and cleaned ready to be cooked and served.
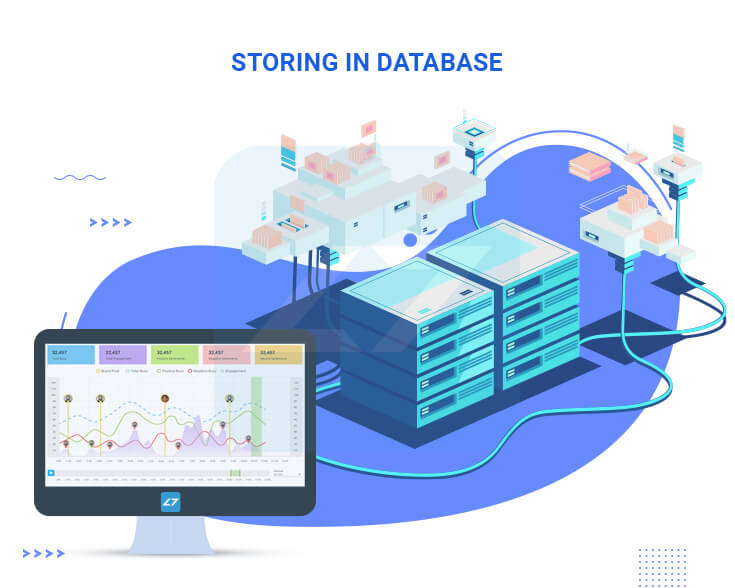
The data we have now has been extracted, cleaned, enriched and structured, this makes it valuable. Most certainly the next step is to persist this data with backups, for this Locobuzz makes use of both SQL and NoSQL cluster of databases. What are these, you ask? A SQL database has a predefined structure in which data is meant to be stored, whereas a NoSQL database does not define a structure and is best suitable for semi-structured records.
Each type has its own pros and cons which is suitable for a specific application. Locobuzz uses the following database technologies:
- SQL Server: Primary SQL store which records structured attributes
- AWS S3: Object storage like images and videos
- ElasticSearch: Extremely fast results for searching through long textual data such as blog posts, news articles and social media posts.
- Redis: Storage of short-lived data such as ticket attributes used in ORM
To maintain redundancy, databases are deployed in clusters. A cluster of databases is a collection of server nodes where each node has its own utility. It can be either the data source or a replica. Replicas maintain backups which are important in case of node failures.
A database node can be read-only which means data can not be updated or changed by an application connected to it whereas in a read-write node data can be read and updated. These clusters are put behind a load balancer, to distribute the load evenly.
Well, we have completed our recipe, all ingredients are cooked and now it’s time to present our dish!
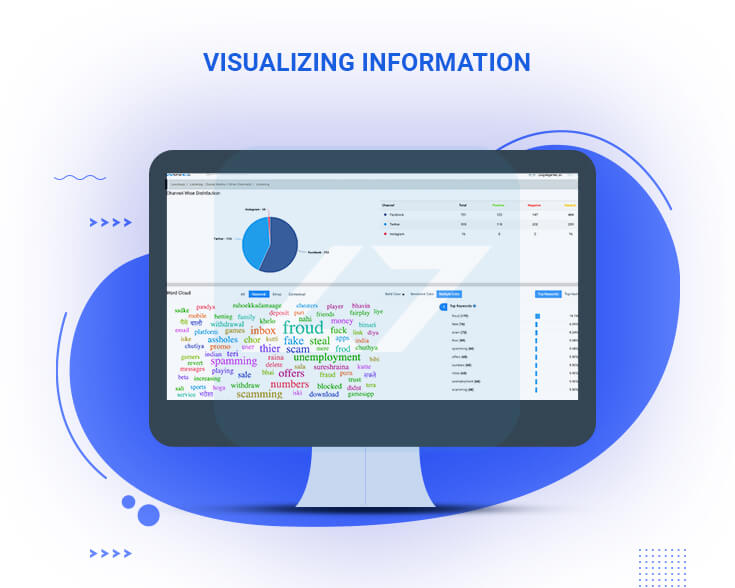
The database can now be queried with SQL to get the information required for visualization. A couple of programming languages are used for backend in Locobuzz namely ASP .Net and Python. Each of these languages has the ability to connect to a database and ask for data, format it and send it to dashboards.
Using frontend technologies such as Javascript, Angular and React. Data is presented in various types such as Charts, Grids and Reports, each being customisable and can be downloaded in the form of PDF.
That’s Locobuzz for you! Our efforts in strengthening data insights ensure that brands truly understand their customers and put their best foot forward with the Real-Time Customer Experience Tool. To know more about Locobuzz, reach out to our sales representatives at sales@locobuzz.com!