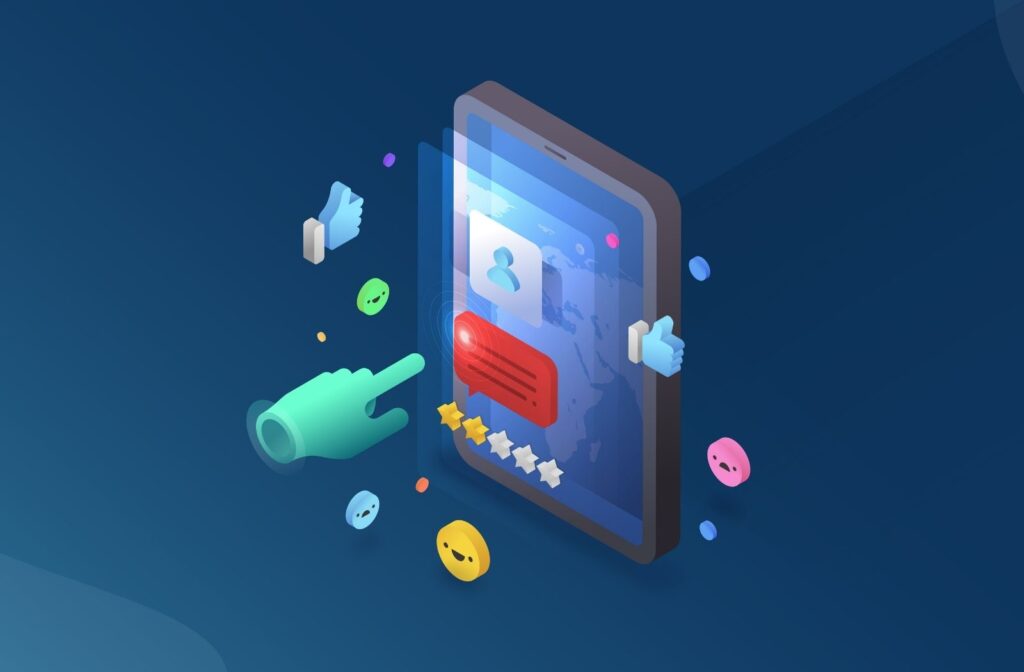
Perfecting The Art Of Data Visualization
Data Visualization is the graphic representation of data. The key is understanding the best ways to reveal complex information at a glance.
During COVID-19, what must your brand do to keep its Online Reputation Management intact? Read on to find out!
Effective Online Reputation Management During COVID Read More »
The virus is here to stay, and cost-cutting on Data Analytics & Customer Engagement isn’t an option. Here’s why!
Why Data Analytics Matters in the Age of COVID-19 Read More »
In 2023, Social Listening is a critical investment and, for many businesses, a life source they cannot do without.
Why is Social Listening a Critical Spend in 2024? Read More »
Here’s how to utilize your Social Media Campaign to actually convert millions of data points into actionable insights.
3 Tiers of Tracking Social Media Campaign Performance Read More »
2021 is going to be the year of chatbots as they become the New World Order of Customer Experience. Here’s why they’re ever so important!
Chatbots in 2024: Why They’re More Important Than Ever! Read More »
User Interface linked with User Experience is the definition of Online Customer Experience, but how to enhance all three aspects? Here’s how!
Why User Interface + User Experience = Customer Experience Read More »
In 2023, Big Data is Big Money. But how do you leverage it? Here’s how to master the art of Social Listening using Big Data Analytics!
Did you know 80% of customers use Social Media to engage with brands? Here’s how to leverage this and improve your own Customer Experience!
Consumer Data? Customer Experience? Think Digital! Read More »
The main question is: Is Big Data only for big companies? The answer is ‘NO’. Find out why and how to use Big Data for an SME.
A Guide to Big Data for Small & Medium Enterprises Read More »